You don’t need to be a statistician or a data analyst to see what gender and age groups are paying the heaviest price whilst walking, cycling or riding on New Zealand roads.
The New Zealand Vulnerable Road User Charitable Trust’s motivation in sharing two decades of Health New Zealand (HNZ) mortality data is so we, all road users and advocates in Road Safety, are aware of all the available data.
There are two sets of data that exist – Crash Analysis Data (CAS) that only captures incidents involving a vehicle, and Health NZ data which records ‘cause of death’ and applies a coding system that meets international statistical classifications.
Currently CAS data informs all decision making in central and local government and transport and enforcement authorities.
Last week HNZ released 2020 mortality data to the Trust. It prompted this renewed focus on sharing the information with community.
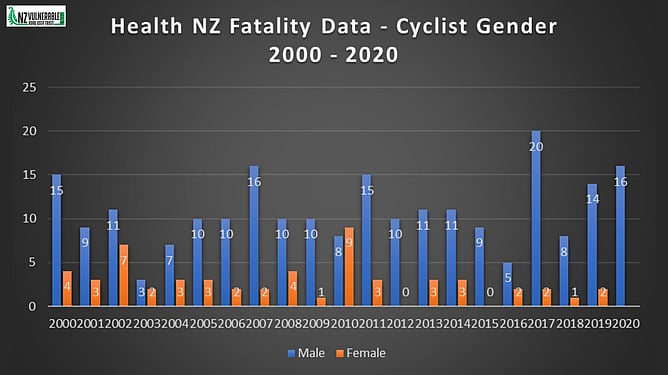
The graph below breaks down the gender of annual cycling fatalities over a 20-year period. Lifting numbers like this off a spreadsheet is heartbreaking. One death is too many.
As an advocate for vulnerable road users, a wife and mother of two boys aged 16 and 10, the picture of blue isn’t lost on me.
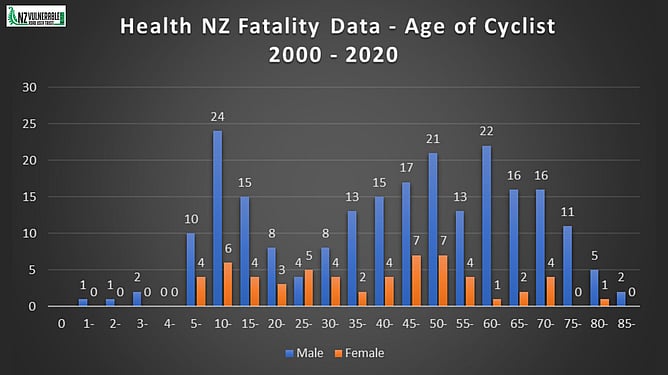
The graph below shows the age of cyclists killed between 2000 - 2020.
For example, there were 24 children aged between 10 & 14-years who lost their lives.
Let’s work together to reduce the blue across the board. Extra care by drivers in approaching and passing a cyclist of any age is required. Give at least 1.5m space – Pass WIDE and SLOW
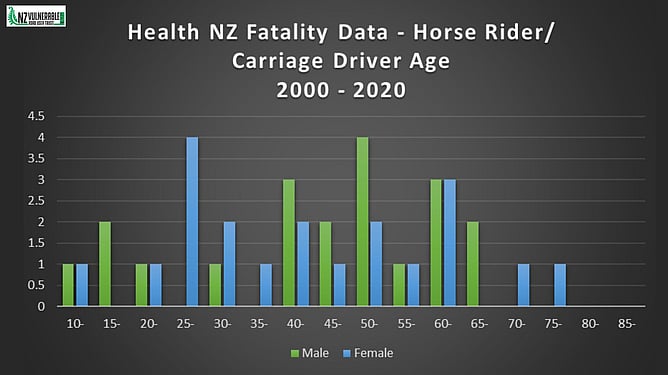
The graph below shows a total of 41 equestrian related deaths recorded with Health NZ for the period 2000 – 2021 and there is an even spit of male and female fatalities up until 2020.
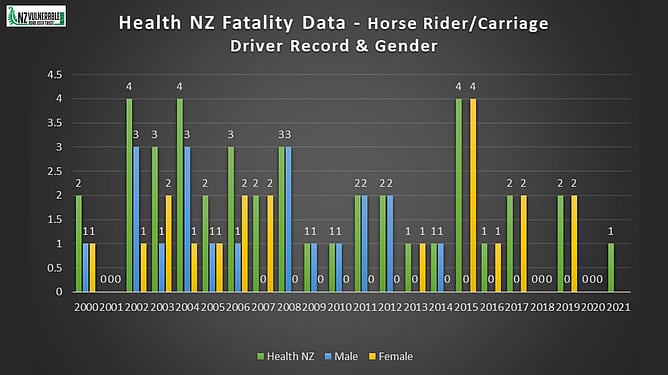
The graph below shows the age of equestrians killed and it was particularly heartbreaking to see two 10-year old’s have lost their lives whilst riding a horse.
When you see an animal like a horse on the road, remember they have a mind of their own and can be unpredictable. Extra care by drivers is required.
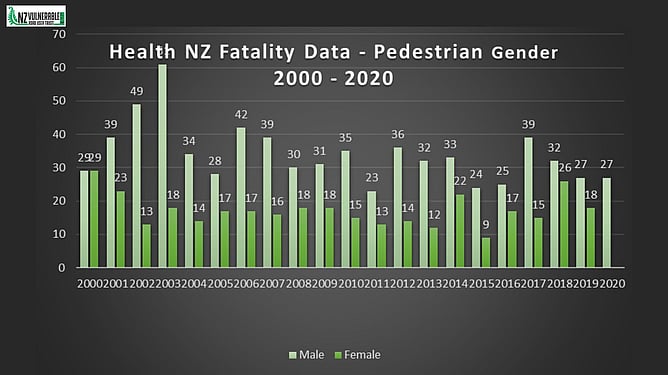
Unbelievable fatality figures when it comes to the number of pedestrians who die as a result of their time on the road, and again, men are paying the heaviest price.
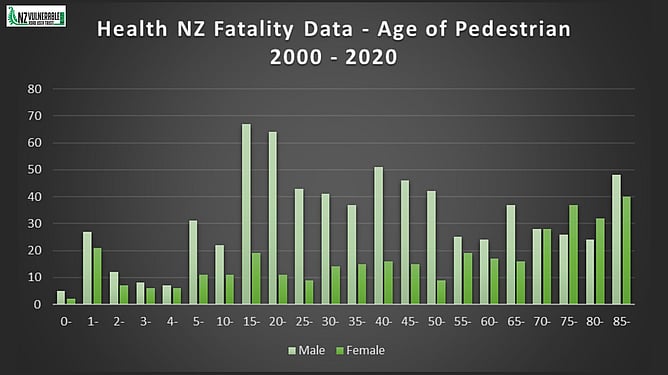
The graph below shows the age of the pedestrian and 5-years and under is a concern. So too is the 15-24-year age bracket for young men, men in their 40s – 50s and our elderly population.
The choices we make as road users, whether on foot, two wheels, horseback, motorbike or behind the wheel of a car, towing vehicle or truck – have direct consequences.
Take precautions to best protect yourself and your loved ones and drive with EXTRA care when approaching and passing vulnerable road users.