It’s a sad fact and the truth sits in mortality data held by Health New Zealand Te Whatu Ora (HNZ).
Every six-months it releases data. Whilst released data for pedestrians and cyclist fatalities is only available to the year 2020, and 2021 for equestrian fatalities, understanding the past can help to inform the present.
To begin
Recorded data meets international statistical classifications. HNZ data is validated through multiple sources including police investigations, coroners, funeral directors, and hospital records.
There is a specific code for each vulnerable road user group. For example, “pedal cyclist injured in transport accident deaths, pedestrian injured in transport accident deaths and animal rider or occupant on a horse-drawn vehicle injured in a transport accident,”.
Cause of death includes all on road situations.
By comparison, the Ministry of Transport’s Crash Analysis System (CAS), which is managed by the New Zealand Transport Agency (NZTA) only captures road crashes that involve a vehicle.
What’s the problem? CAS data is the only data used to inform decision making. This is in the area of policy and legislation, priority and design of road safety initiatives, support for funding applications and research, public statistics and CAS stats are used by the authorities to evaluate safety measures. It’s the foundation for life saving work.
Here is a deeper dive into fatality data held by two agencies – one is responsible for managing the land transport system and the other is responsible for operating the health system.
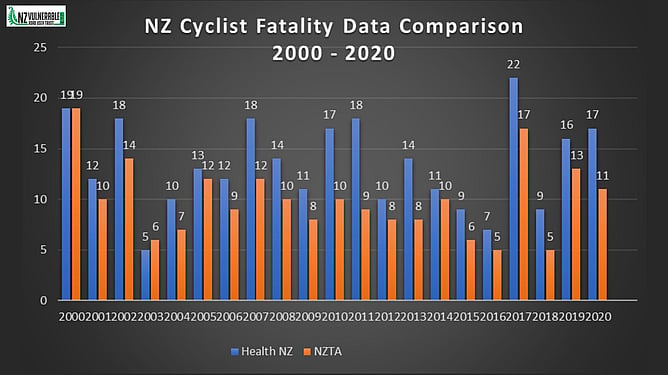
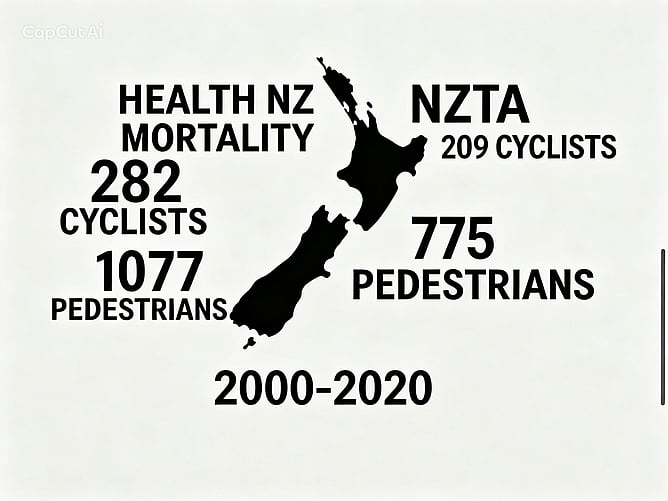
Total number of cyclists killed on the road – Health NZ 282 and NZTA 209 between 2000 - 2020
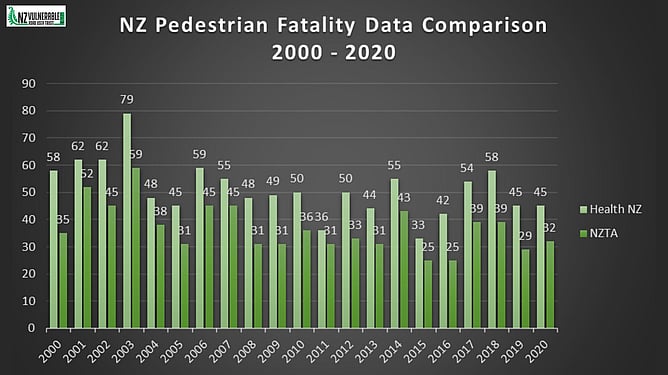
Total number of pedestrians killed on the road – Health NZ 1077 and NZTA 775 between 2000 - 2020
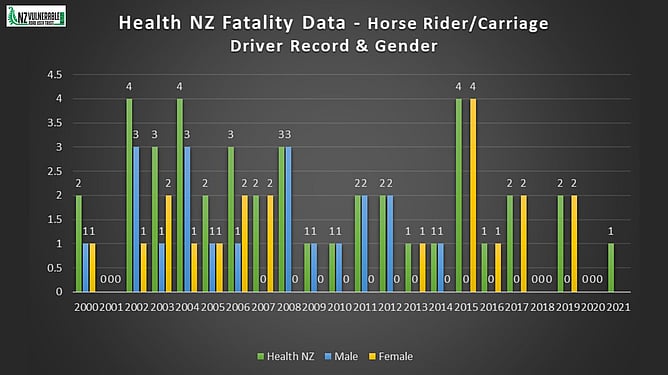
NZTA has 8 equestrian deaths recorded between 1980 – 2024.
It collects three types of fatalities involving horses. Equestrian, driver and passenger deaths.
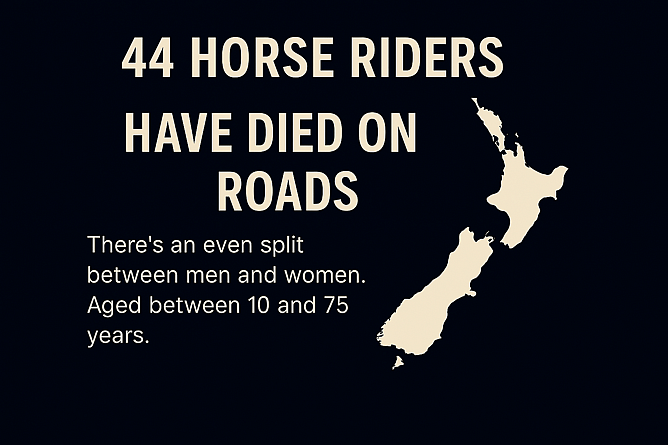
WorkSafe has recorded three horse road-riding fatalities in 2022. Total lives lost on the road is 44 between 2000 – 2022.
These equestrian fatality statistics were first discovered in December 2024. Up until this point, data didn't reflect the anecdotal evidence within the equestrian community that there were problems on the road.
Good data helps to inform advocacy efforts, and in turn can lead to informed decisions or targeted messaging and education.
The new fatality statistics were tabled as part of evidence in June 2025 at Parliament's Transport and Infrastructure Select Committee. This evidence helped to strengthen the request for horse riders/ carriage drivers to be formally recognised in transport legislation as vulnerable road users. Currently equestrians are categorised as an 'other' road user and are therefore NOT included in road safety education and messaging campaigns, or off-road infrastructure.
In creating these graphs to illustrate the difference in annual fatality figures, it is abundantly clear that we must do more to prevent this unnecessary loss of life. Improved road safety outcomes involve every single one of us and the choices we make. Let's make a commitment to exercise patience by slowing down and giving space when you see a person on foot, two wheels or horseback on the road - Pass Wide and Slow.
New Zealand transport authorities have made a commitment to the United Nations Road Safety Strategy, which has set an objective to halve road deaths and injuries by 50% by 2030. The Trust will examine this in more detail but will leave you to join the dots when it comes to two sets of data telling a different story.